The BNB price failed to join the cohort of cryptocurrencies that managed to post massive gains since the end of February. However, the altcoin did manage to reach the $500 mark.
But by the looks of it, BNB will be stopped short in its path before it can revisit that milestone.
BNB Investors Might Tap Out
The BNB price rise did not impress its investors as other altcoins did, resulting in BNB holders losing optimism. This is evident in the investors’ declining weighted sentiment. The metric is used to gauge the investors’ overall interest and sentiment.
Generally weighted sentiment surges during periods of high social volume with predominantly positive messages. Conversely, dips happen when the social volume is high, but sentiment turns negative.
The latter conditions are true for BNB, as the weekly average sentiment is at a nine-month low.
Read More: How To Buy BNB and Everything You Need To Know
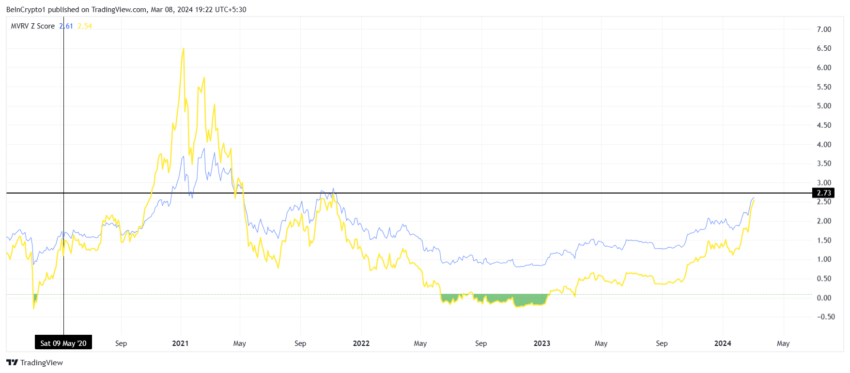
Secondly, the MVRV Z-score does not favor the altcoin much, either. The MVRV Z-score compares a cryptocurrency’s market value to its realized value, signaling over or undervaluation. Positive scores imply overvaluation and negative undervaluation, aiding investors in gauging market sentiment and potential price outcomes.

As visible on the chart, the MVRV Z-score for BNB is on the verge of breaching the 2.73 threshold. Breaching this level would suggest that the cryptocurrency is likely overvalued and result in selling by investors before BNB corrects significantly.
Read More: Binance Review 2024: Is It the Right Crypto Exchange for You?
BNB Coin Price Prediction: Is a Decline on the Horizon
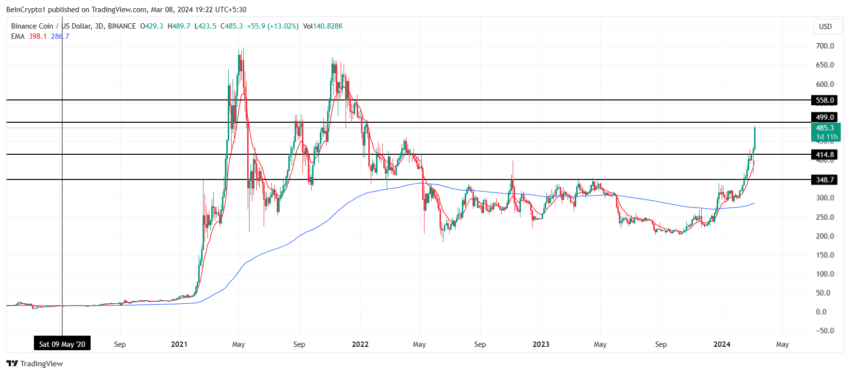
BNB Coin’s price is trading at $485 at the time of writing, closer to the two-year resistance level of $499. However, given the aforementioned developments, the likely outcome for BNB is a price decline.
A failed breach will drag BNB down to $414, erasing most of the gains noted by the altcoin in the past month.
However, the BNB price is observed as a Golden Cross on the 3-day chart. This rather rare phenomenon has occurred for the first time since February 2023 on a longer timeframe.

A golden cross is a bullish signal, occurring when a short-term 50-day, cross above a long-term 200-day moving average. This crossover suggests increasing upward momentum and typically signifies a potential shift to a bullish trend.
Since this is ongoing, the bullish momentum could likely be sustained for a while longer. This would hep BNB price breach the $500 mark and invalidate the bearish thesis if it tests the price point as support.
The post Here’s Why the BNB Price May Fall Short of $500 Target appeared first on BeInCrypto.


Be the first to comment