The VeChain (VET) price lost a crucial horizontal support level but shows bullish signs in lower time frames.
A bounce at the current level will mean that the trend is bullish, and the correction is complete. However, failure to reclaim the long-term horizontal support level will be a bearish long-term sign.
VeChain Price Falls Below Crucial Support
The weekly time frame outlook provides a relatively bearish outlook. It shows that the price has fallen below the $0.022 horizontal support area. The decrease below the area is crucial since the price had seemingly reclaimed it at the beginning of the year.
After the ensuing decrease, the area is expected to provide resistance again. The RSI is a momentum indicator used by traders to evaluate whether a market is overbought or oversold and to determine whether to accumulate or sell an asset.
Readings above 50 and an upward trend suggest that bulls still have an advantage, while readings below 50 indicate the opposite.
The weekly RSI provides a bearish reading. The indicator is below 50 (red icon) and decreasing, suggesting that the trend is bearish.
VET Price Prediction: Is the Correction Complete?
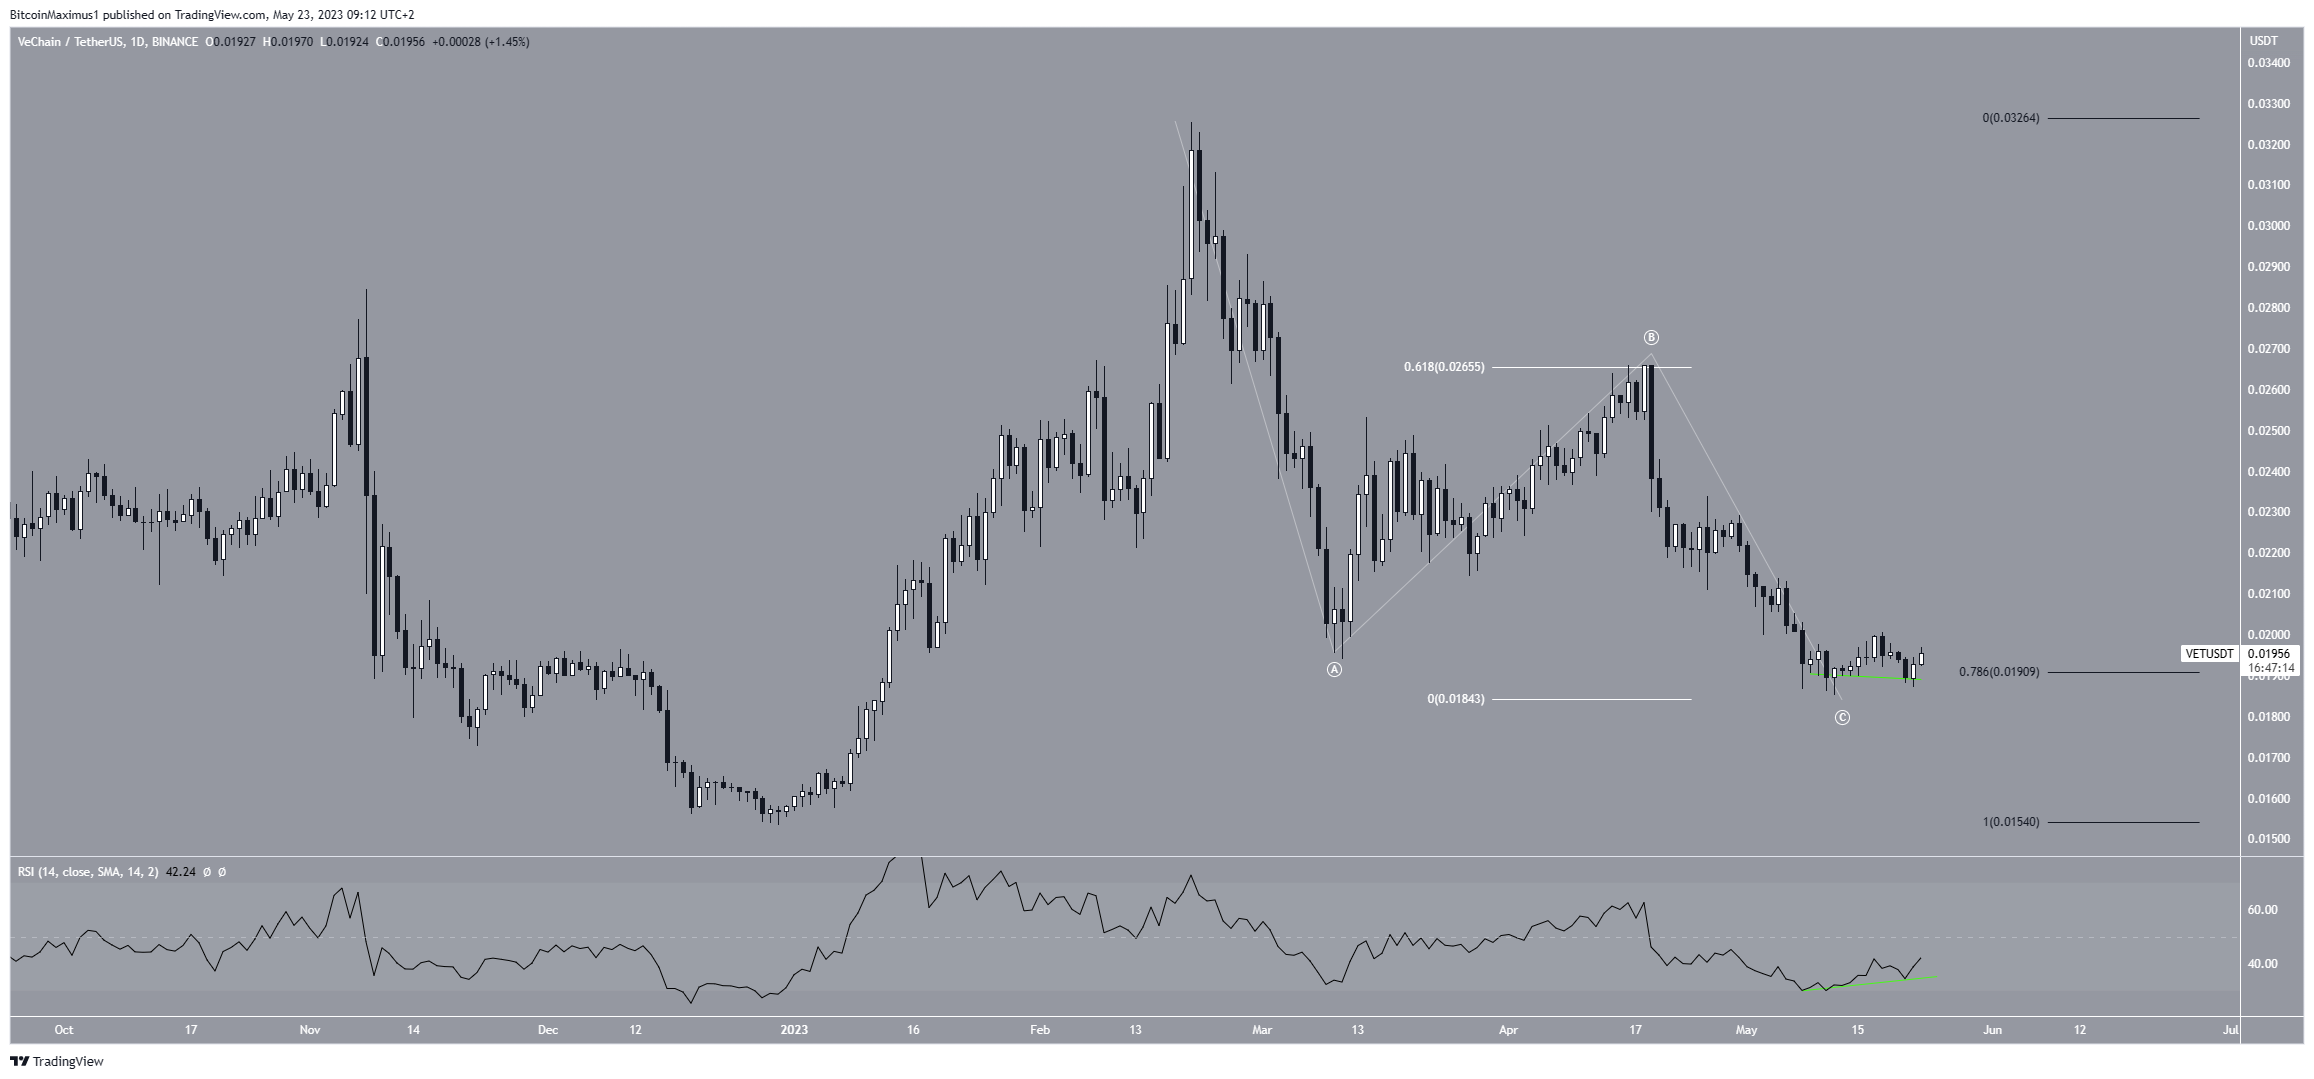
Despite the bearish weekly readings, the technical analysis from the daily time frame suggests that correction ongoing since the end of February might be complete.
There are several reasons for this. Firstly, the daily RSI has generated a bullish divergence (green line). This is an occurrence when a momentum decrease does not accompany a price decrease. It often leads to bullish trend reversals.
Next, this divergence is happening at the 0.786 Fib retracement support level. According to the Fibonacci retracement levels principle, following a significant price change in one direction, the price is expected to partially retrace or go back to a previous price level before resuming in its original direction.
The 0.786 Fib level could act as the bottom after a correction.
Finally, the wave count aligns with the possibility of a complete correction. The Elliott Wave theory, employed by technical analysts, involves the analysis of recurring long-term price patterns and investor psychology to determine the direction of a trend.
The wave count shows an A-B-C structure (white), in which waves A:C had an exactly 1:0.618 ratio (white). This is the second most common ratio in such corrections.
So, it is possible that the VET price correction is complete, and an upward movement will now follow.

However, a close below $0.18 will invalidate this bullish VET price prediction and wave count.
If that occurs, the VET price could fall to the next closest support area at $0.15.
For BeInCrypto’s latest crypto market analysis, click here.
Disclaimer
In line with the Trust Project guidelines, this price analysis article is for informational purposes only and should not be considered financial or investment advice. BeInCrypto is committed to accurate, unbiased reporting, but market conditions are subject to change without notice. Always conduct your own research and consult with a professional before making any financial decisions.


Be the first to comment