The Shiba Inu (SHIB) price broke down from a 350-day pattern, in a movement that could be just the beginning of a significant decrease.
While short-term timeframes allow for the possibility of a bullish reversal, the weekly timeframe is conclusive in predicting a bearish trend.
Shiba Inu Price Breaks Down From 350-Day Pattern
The weekly time frame technical analysis gives a bearish forecast for the Shiba Inu price. The main reason for this is the breakdown of a symmetrical triangle pattern, which had been in place since June 2022.
At the time of the breakdown, the price had traded in the pattern for 350 days.
After breaking down, the SHIB price reached the $0.0000058 horizontal support area and bounced. The area had not been reached since the end of 2021.
The weekly RSI gives a bearish reading. Traders utilize the RSI as a momentum indicator to assess whether a market is overbought or oversold and to determine whether to accumulate or sell an asset.
If the RSI reading is above 50 and the trend is upward, bulls still have an advantage, but if the reading is below 50, the opposite is true. The indicator is below 50 and decreasing, a sign of a bearish trend.
SHIB Price Prediction: Where to From Here?
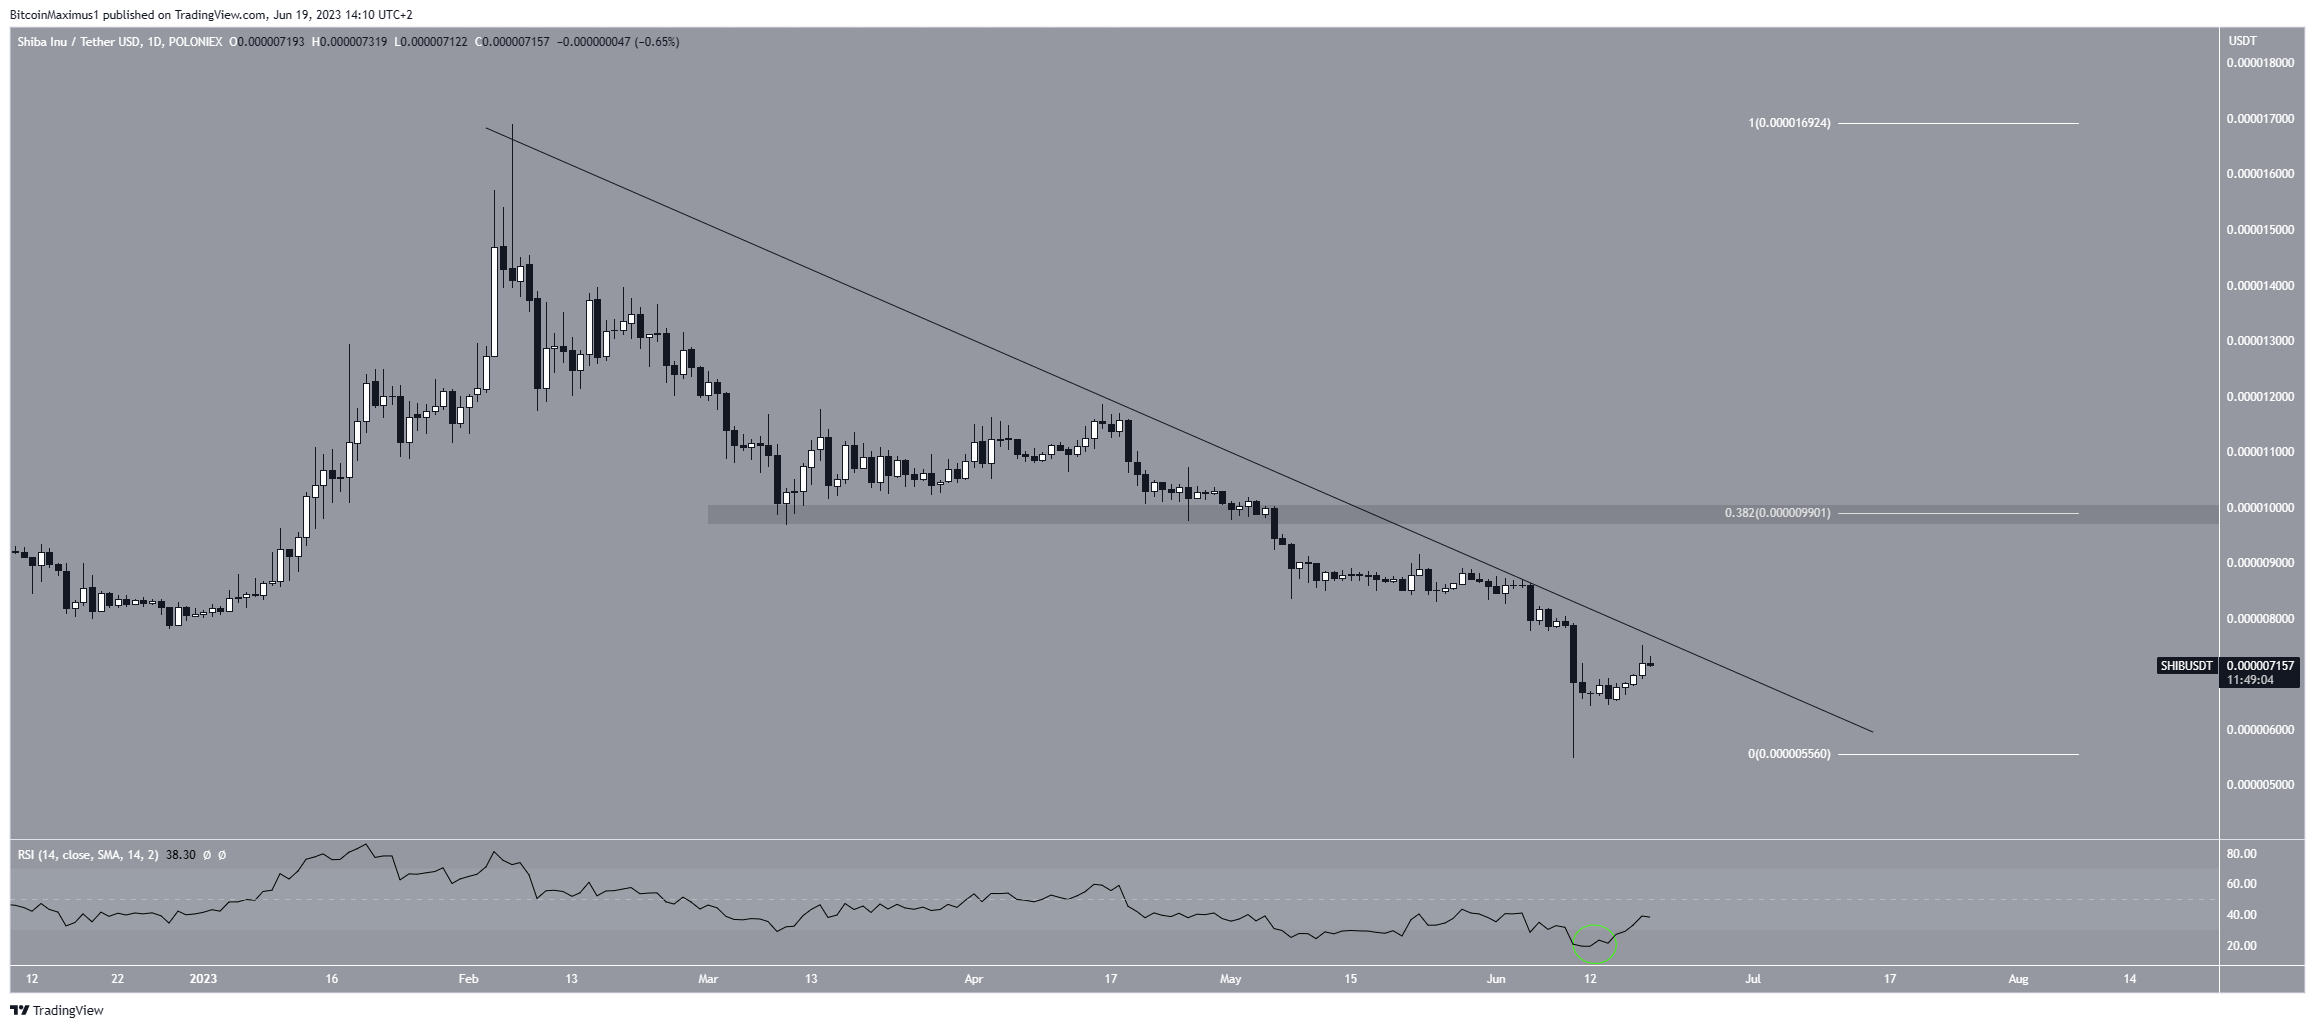
While the technical analysis of the weekly time frame is decisively bearish, the daily time frame offers hope for a bullish reversal. The main reason for this is the daily RSI, which just moved outside of its oversold territory.
Before doing so, it fell to an all-time low reading of 22 (green circle). However, no bullish divergence confirms the possibility of a reversal.
Moreover, the SHIB price has followed a descending resistance line since the beginning of February. Whether it breaks out from it or gets rejected will be crucial in determining the trend’s direction.
A breakout could lead to an increase to the next closest resistance at $0.0000010. This is the 0.382 Fib retracement resistance level and a horizontal resistance area. Due to this confluence, it could provide strong resistance.
On the other hand, if the SHIB price gets rejected, it could initiate another sell-off toward $0.0000040.

The SHIB price prediction is unclear due to conflicting readings from the weekly and daily time frames. Whether the price breaks out or gets rejected from the current descending resistance line will determine the future trend’s direction.
A breakout can lead to an increase toward $0.0000100, while a rejection could cause a fall to $0.0000040.
For BeInCrypto’s latest crypto market analysis, click here
Disclaimer
In line with the Trust Project guidelines, this price analysis article is for informational purposes only and should not be considered financial or investment advice. BeInCrypto is committed to accurate, unbiased reporting, but market conditions are subject to change without notice. Always conduct your own research and consult with a professional before making any financial decisions.


Be the first to comment