Recent data indicates that the price of Pepe (PEPE), the frog-themed meme coin on Ethereum, presents a rare buying opportunity. PEPE’s trading volume surged by 48% today, reflecting renewed market interest.
Despite the increased volume, PEPE’s value has dropped by 42% over the past 90 days, leaving many short-term holders with unrealized losses. Where will the price head next?
Pepe Oversold, Presents a Buying Opportunity
According to IntoTheBlock, Pepe’s Market Value to Realized Value (MVRV) ratio is currently 1.34. This key metric helps identify market tops and bottoms by comparing the total value investors hold to the value they’ve invested.
A higher MVRV ratio signals that investors are sitting on more unrealized profits and may be inclined to sell. Conversely, a lower ratio suggests that investors, likely holding at a loss, are less inclined to sell at a reduced value.
On May 28, the MVRV ratio peaked at 3.29, aligning with PEPE’s all-time high and signaling a market top. The current ratio of 1.34, with PEPE priced at $0.0000071, suggests that the token may have reached a bottom.
Read more: 5 Best Pepe (PEPE) Wallets for Beginners and Experienced Users
If that’s the case, PEPE appears undervalued, and its price could be poised for a rally. The Money Flow Index (MFI) further supports this outlook.
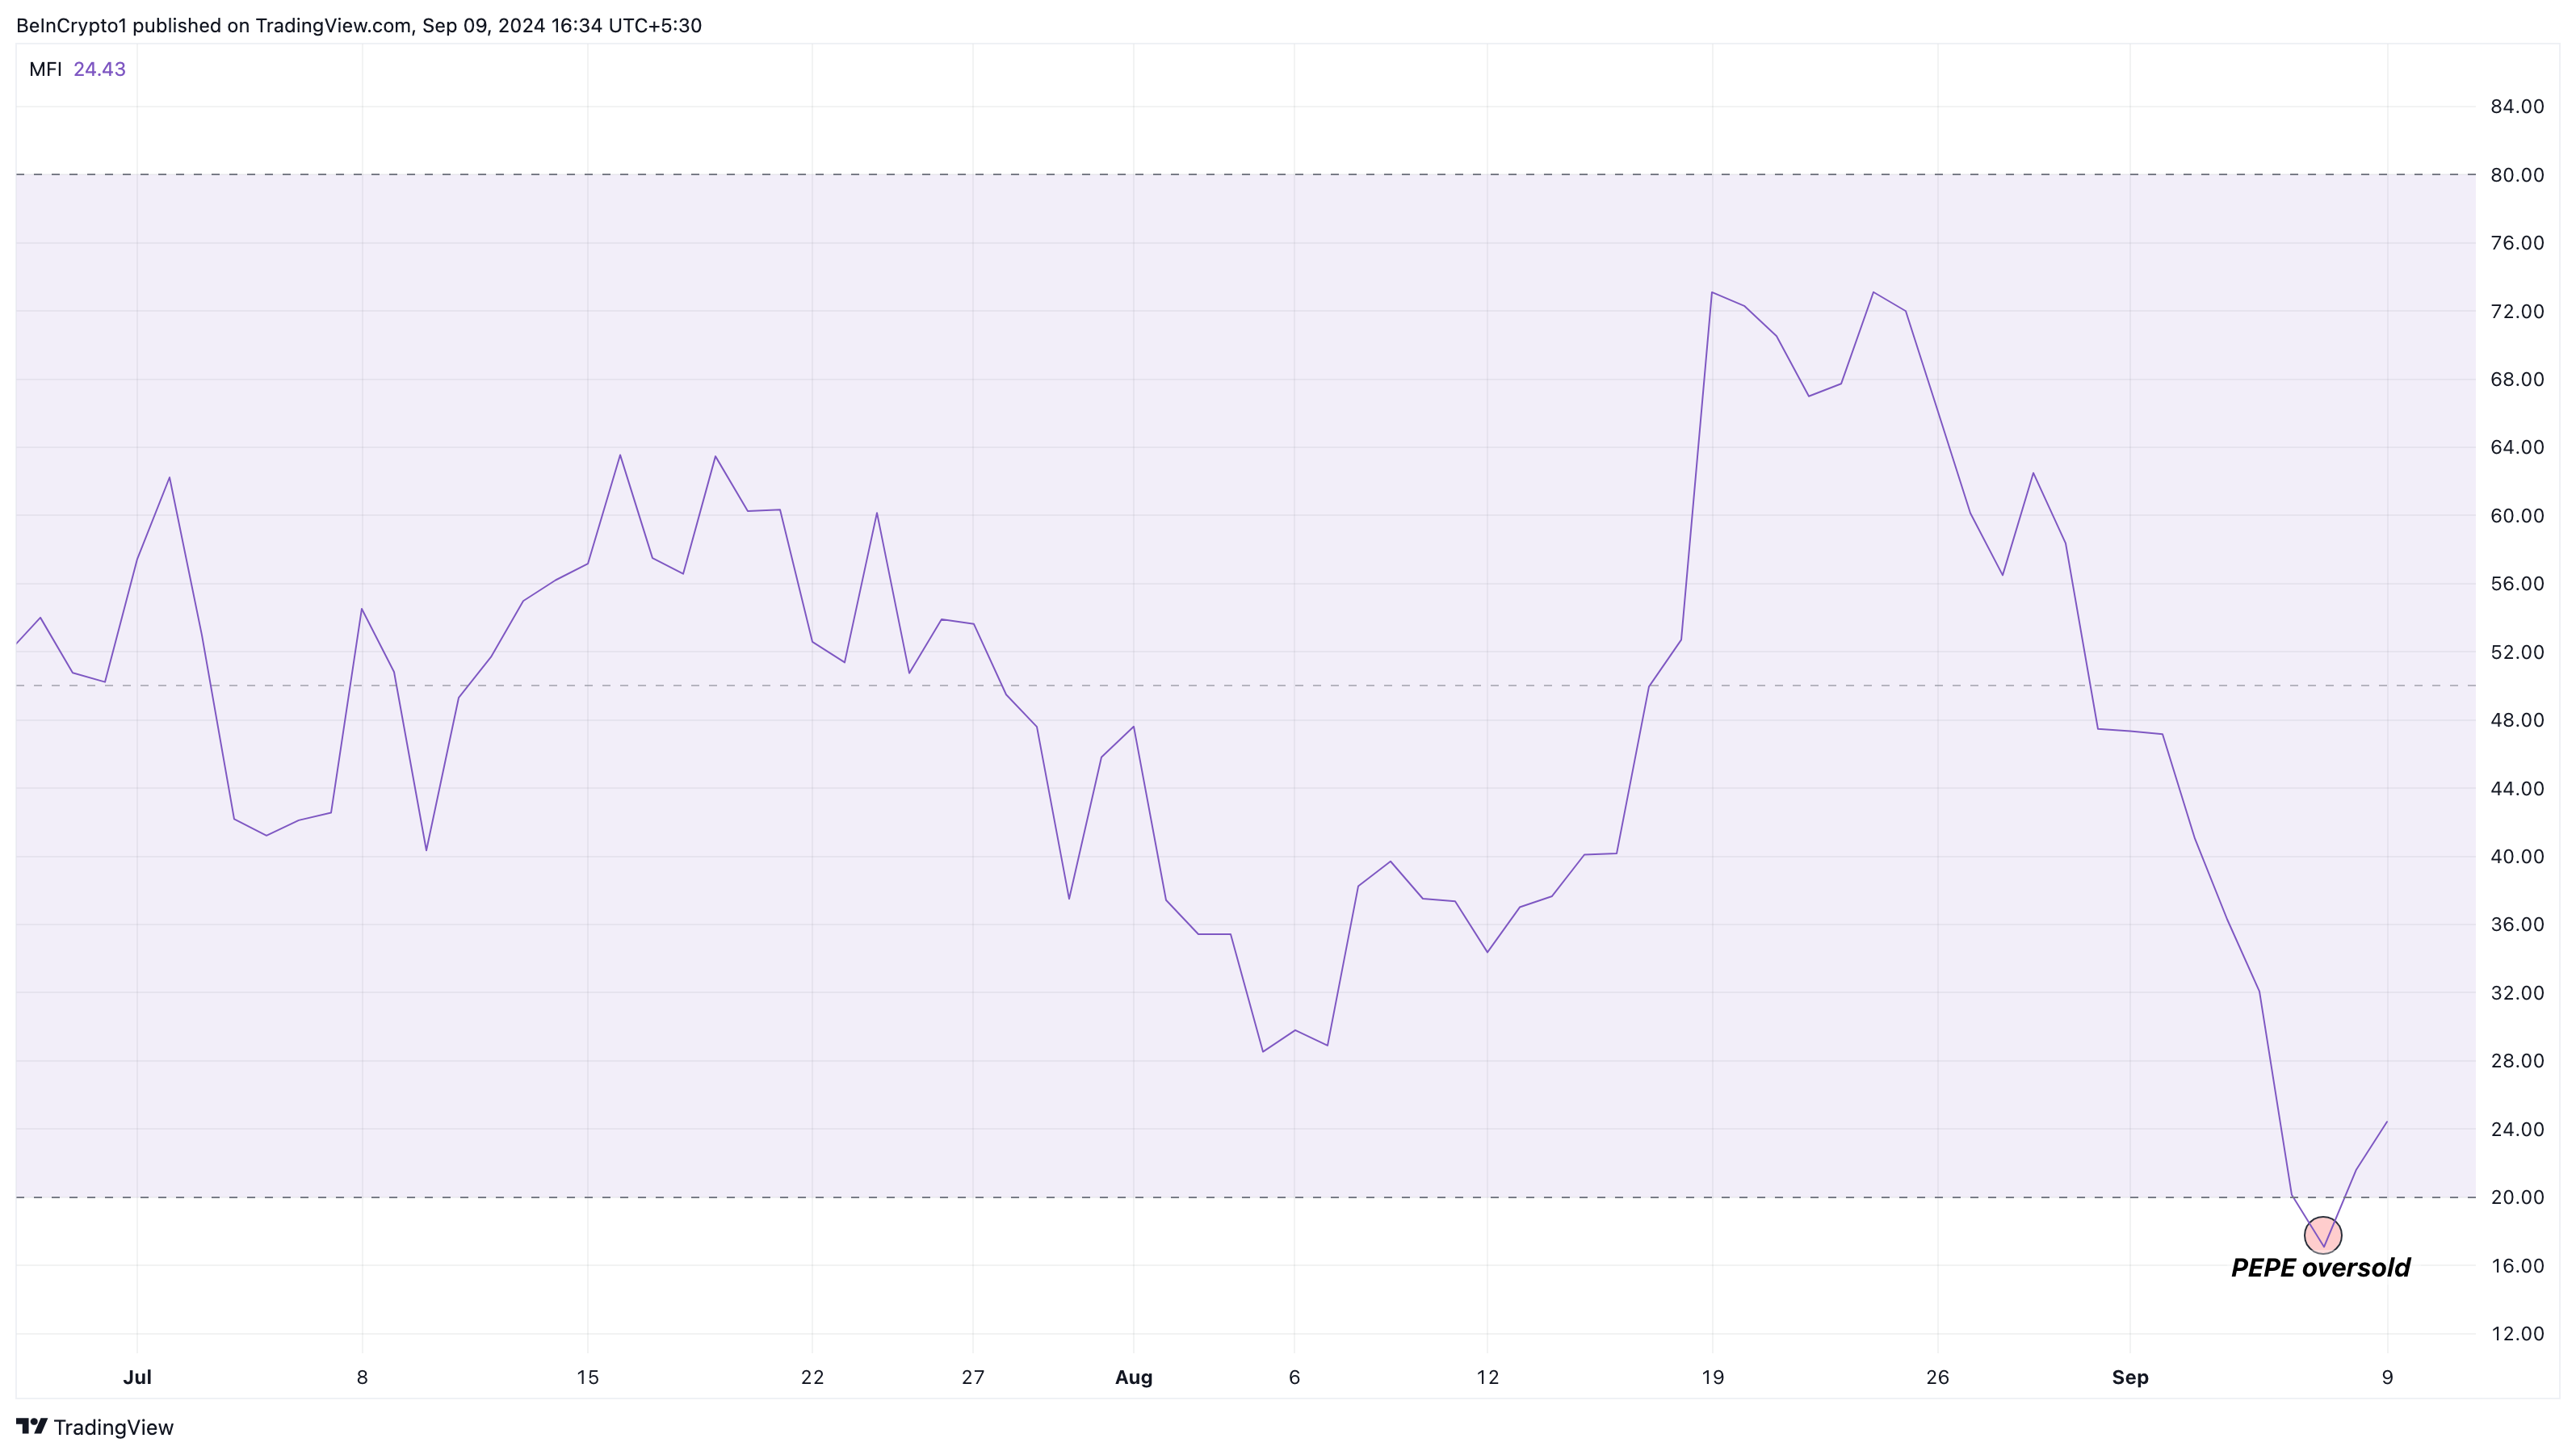
As a technical indicator that measures buying and selling pressure, the MFI ranges between 0 and 100, helping identify when an asset is overbought or oversold. A reading above 80 indicates overbought conditions, while a reading below 20 signals the asset is oversold.
On September 7, the MFI dropped to 17.25, marking PEPE as oversold. As of now, the MFI has risen slightly, indicating that a potential bullish reversal may be forming.

PEPE Price Prediction: Analysis Targets $0.000010
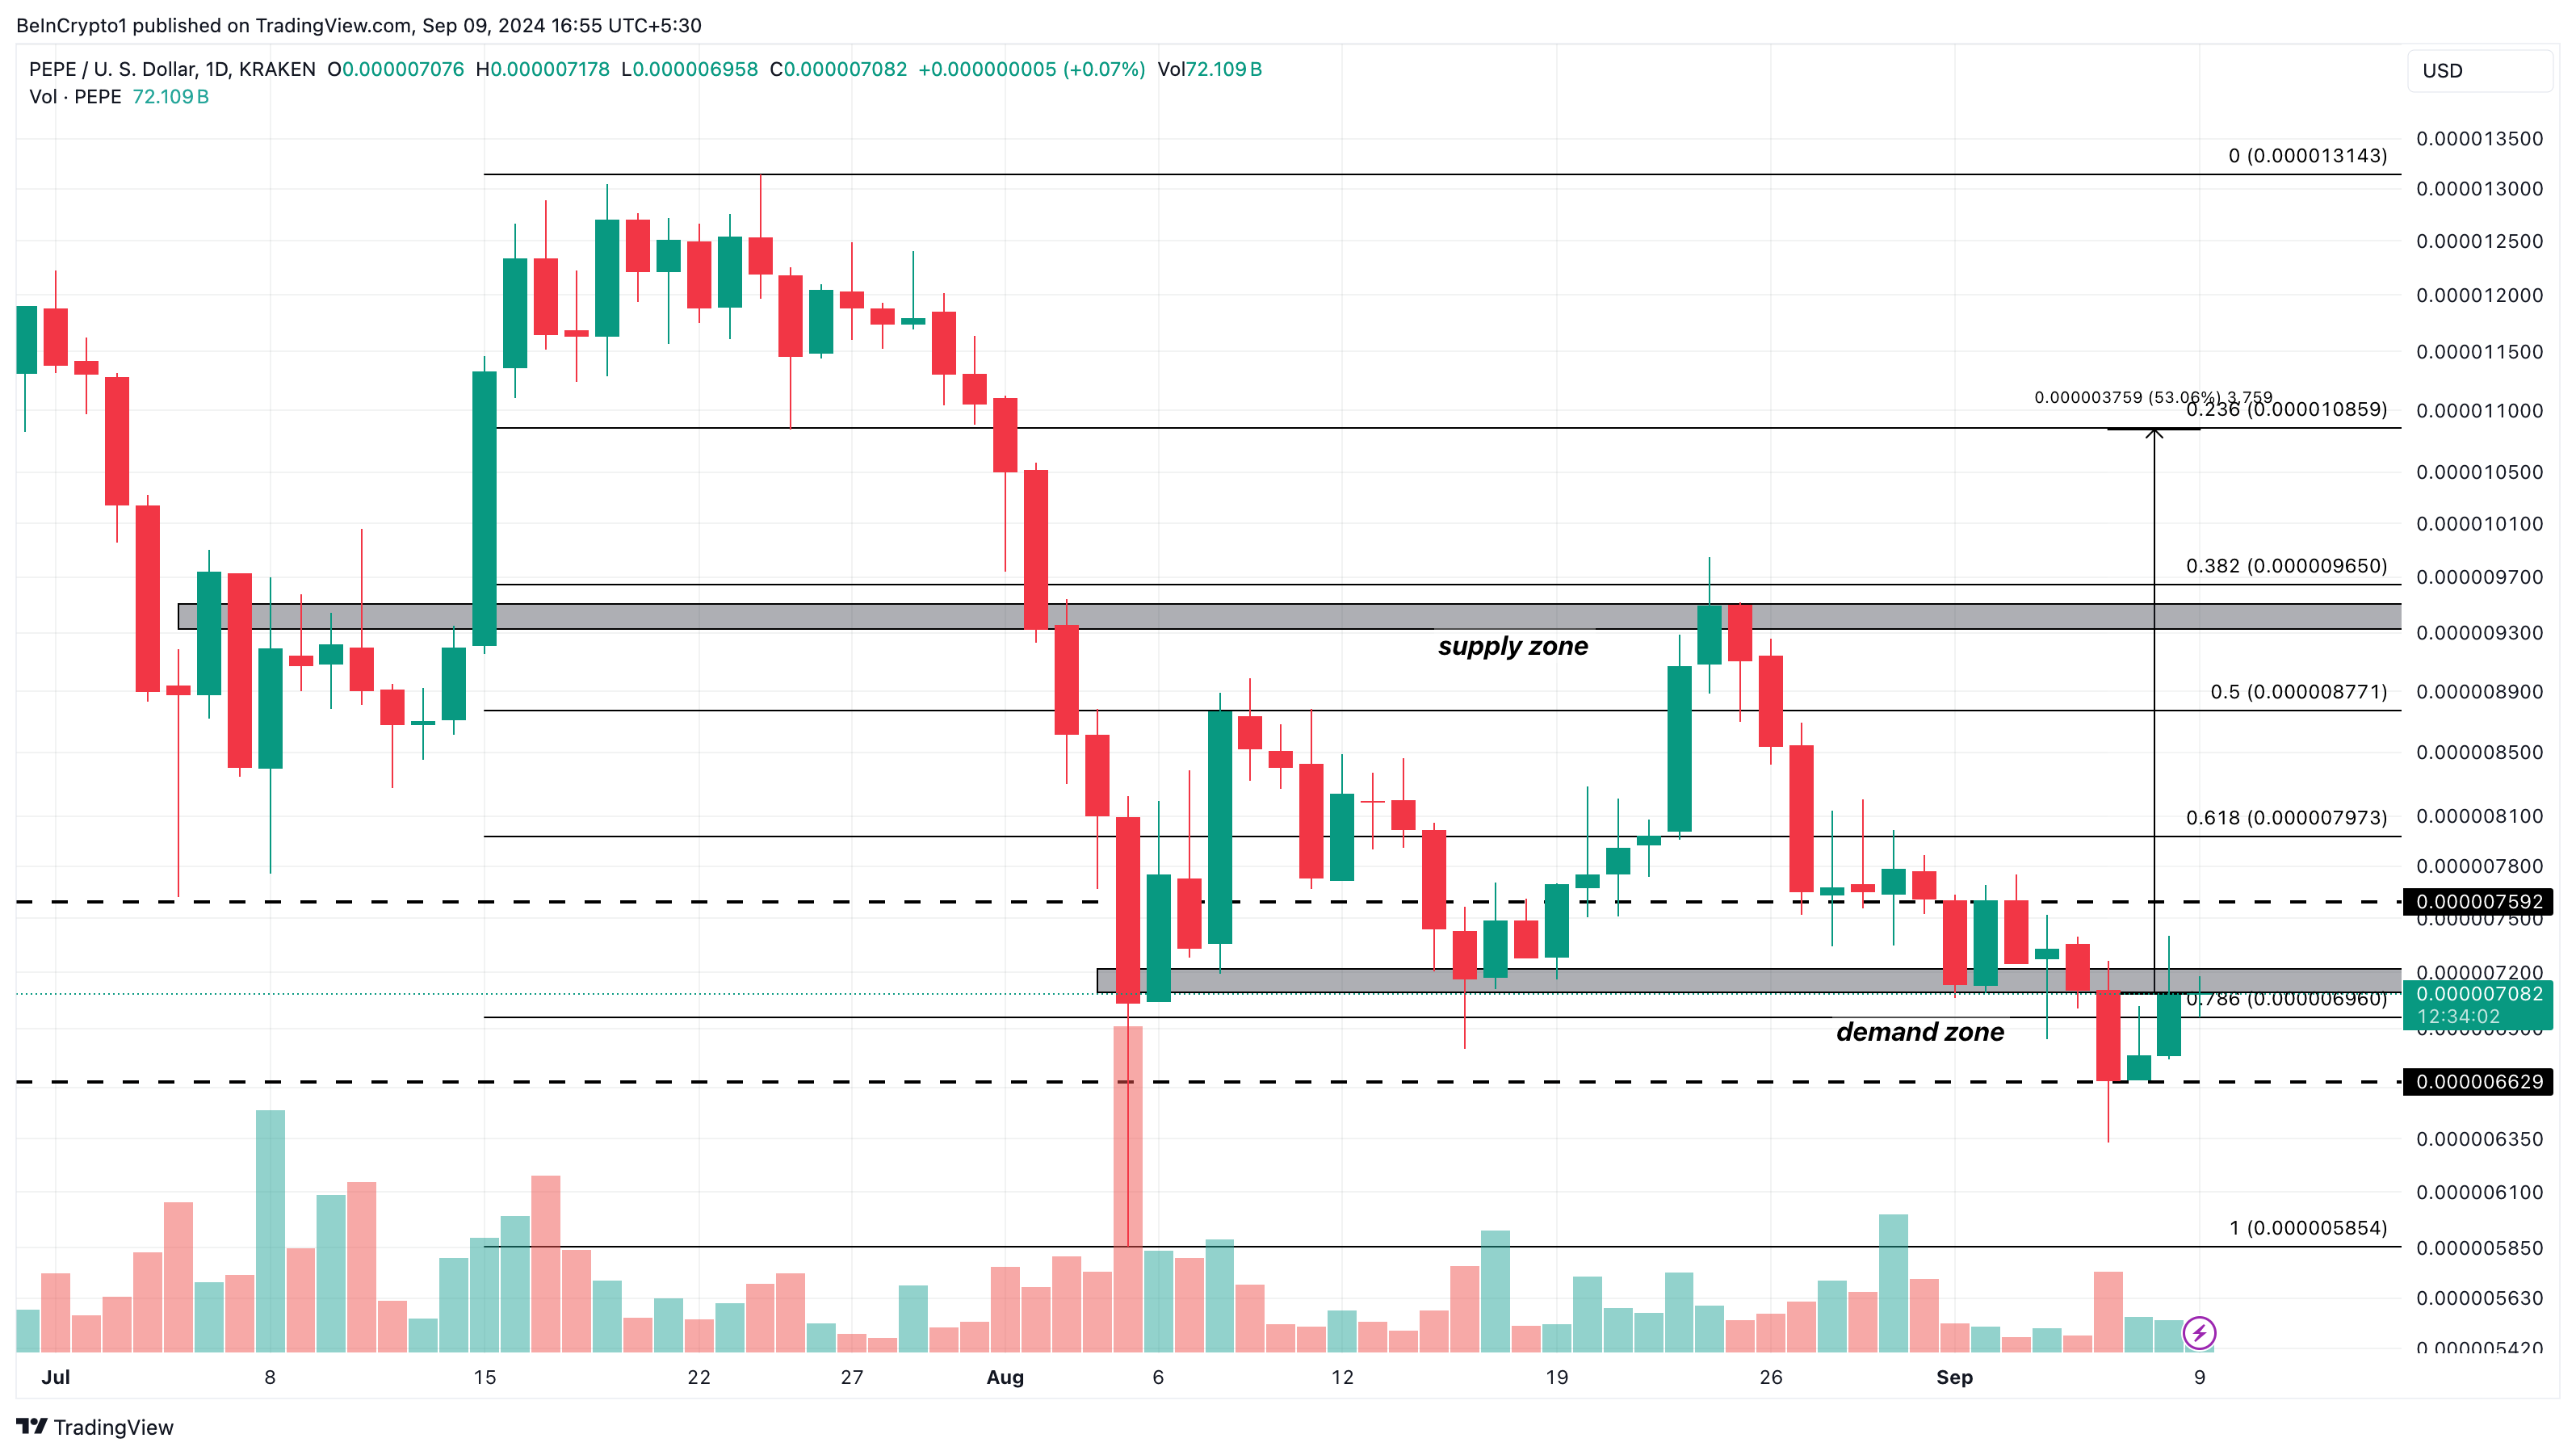
On the daily chart, BeInCrypto noted that PEPE’s price broke out of its downtrend over the weekend, moving from $0.0000066 to $0.0000070. Currently trading at $0.0000070, PEPE is in a demand zone that previously pushed its price from $0.0000070 to $0.0000087 between August 5 and 8.
The chart suggests PEPE might attempt to rise above the 61.8% Fibonacci retracement level at $0.0000079, which could act as resistance. However, if buying pressure increases, the token could break through this level.
Another key area to watch is the supply zone between $0.0000093 and $0.0000095, where PEPE has faced rejections before. If it surpasses this zone, the next target could be around $0.000010, a potential 53% increase from the current price.
Read more: Pepe (PEPE) Price Prediction 2024/2025/2030

Despite this bullish outlook, traders should keep an eye on the resistance at $0.0000075. If PEPE fails to break past this level, the forecast could be invalidated, leading to a potential drop back to $0.0000066.
Disclaimer
In line with the Trust Project guidelines, this price analysis article is for informational purposes only and should not be considered financial or investment advice. BeInCrypto is committed to accurate, unbiased reporting, but market conditions are subject to change without notice. Always conduct your own research and consult with a professional before making any financial decisions. Please note that our Terms and Conditions, Privacy Policy, and Disclaimers have been updated.


Be the first to comment