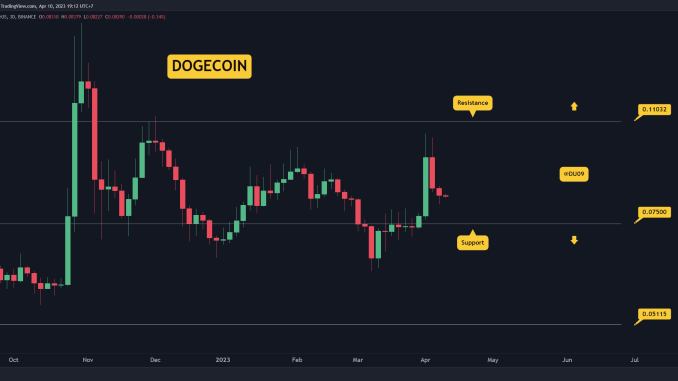
With DOGE buyers out of steam, the price fell and is now approaching the key support.
Key Support levels: $0.07
Key Resistance levels: $0.11
After a significant spike in the price, bulls failed to run it higher, and it lost 20% of its valuation in the last three days. This puts DOGE on a clear path to retest the key support at 7 cents. If it holds, buyers could attempt to reverse the current bearish momentum. The resistance continues to hold strong at 11 cents.
Trading Volume: The selling volume exceeded the buying volume after the spike in price, which explains why bears have the upper hand right now.
RSI: The daily RSI is just above 50 points. Should bulls manage to keep it there, then they could take control of the price action.
MACD: The daily MACD is flat, but the moving average remains bullish, and momentum could return.
Bias
The bias for DOGE is bearish right now.
Short-Term Prediction for DOGE Price
With the price around 8 cents, buyers could return to DOGE as it approaches the key support at 7 cents. Dogecoin could also enter a quieter period which might see its price move sideways for a while until momentum returns.
Binance Free $100 (Exclusive): Use this link to register and receive $100 free and 10% off fees on Binance Futures first month (terms).
PrimeXBT Special Offer: Use this link to register & enter CRYPTOPOTATO50 code to receive up to $7,000 on your deposits.
Disclaimer: Information found on CryptoPotato is those of writers quoted. It does not represent the opinions of CryptoPotato on whether to buy, sell, or hold any investments. You are advised to conduct your own research before making any investment decisions. Use provided information at your own risk. See Disclaimer for more information.
Cryptocurrency charts by TradingView.


Be the first to comment