On July 14, the total number of Bitcoin (BTC) available on exchanges was 2.99 million. Five days later, that figure considerably increased.
An assessment of Glassnode’s data reveals that this number is almost the same as the exchange balance back in March. Will the price react similarly?
Major Bitcoin Exodus from Cold Wallets
In crypto, history does not exactly repeat itself. However, patterns rhyme. Sometimes, it does not matter if the cycles are years apart.
On March 11, Bitcoin’s exchange balance, which is the total number of coins on exchanges, was 3.04million. The coin’s price at that time was around $71,455, close to its all-time high.
Usually, when the number of coins on exchanges increases, selling pressure increases. BTC went through a similar path in March, as the price dropped to $68,960 about a month later.
Read More: Who Owns the Most Bitcoin in 2024?
As of this writing, Bitcoin’s exchange balance is 3.04 million, indicating a notable influx of coins into the platforms over the past four days.
BTC recently survived the selling pressure after Germany sold coins worth billions. However, earlier in the week, the price went up to $65,841 but currently trades at $64,166. This recent decline can be linked to the surge in the number of coins on exchanges.
Should the value continue to rise, Bitcoin might take the opposite direction and probably slip below $63,000 in the coming days or weeks.
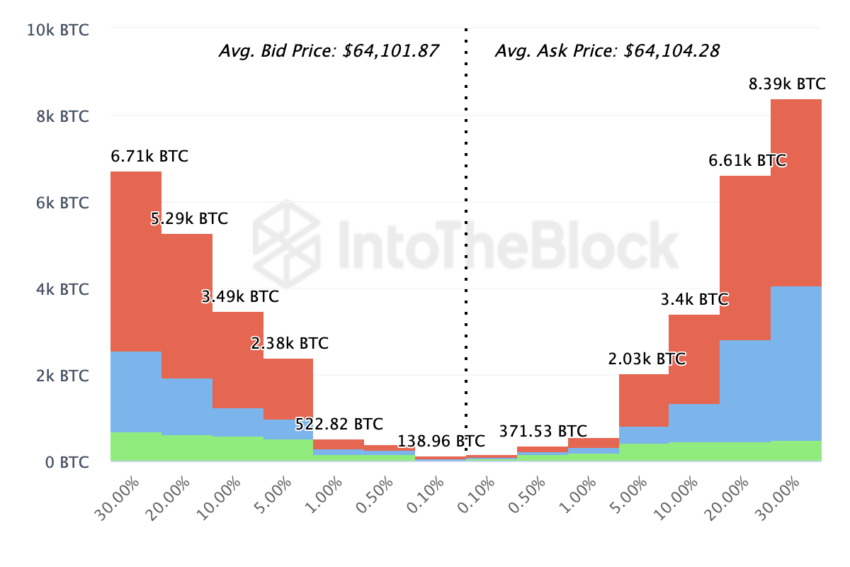
The Exchange On-chain Market Depth provides more insights into this potential. This metric examines the order books and identifies potential buying and selling on-chain.

According to the image above, participants have more coins ready to be sold (ask) than the ones to be bought (bid) around the same price of $64,101. Considering the difference in buying and selling, Bitcoin’s price could be close to another decrease.
BTC Price Prediction: Will the Coin Pull Through This Time?
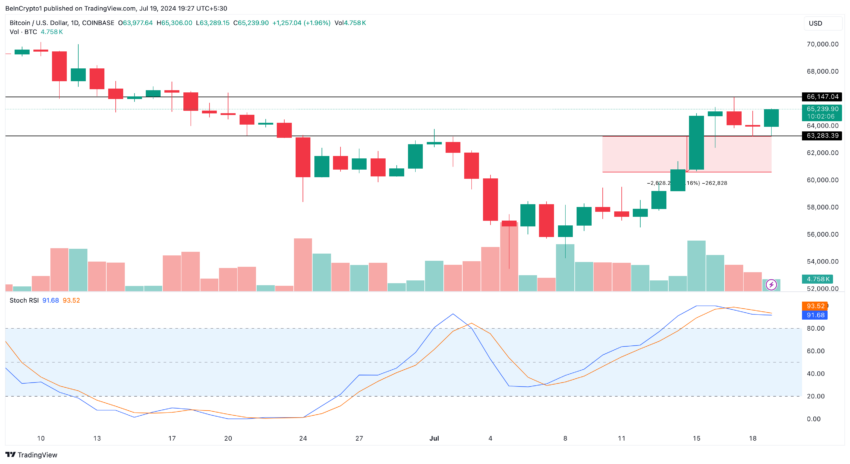
Bitcoin’s current trade setup shows that it has consolidated in a range since it recently climbed past $63,000. Furthermore, the resistance at $66,147 hinders the coin from aiming toward $68,000.
However, bulls look to be clamoring for support at $63,283. However, the Stochastic RSI shows that the support may not hold, considering the coin is overbought.
The Stock RSI is a technical oscillator that measures momentum. It shows whether a cryptocurrency is overbought or oversold. A reading of 80 or more indicates overbought levels, while those at 20 or below suggest otherwise.
As seen in the image below, the indicator’s reading is over 80, reinforcing the notion that BTC is overbought. Consequently, the price of the coin could drop by 3.97% and head toward $60,615.
Read More: Bitcoin (BTC) Price Prediction 2024/2025/2030

In addition, the lack of retail demand for BTC could drag the price down. In previous cycles, a surge in retail investors kept the price of Bitcoin going up.
However, this cycle has been largely dominated by institutional investors who seem to be taking breaks between active participation. CryptoQuant’s CEO Ki Young Ju puts it into perspective, saying that,
“Bitcoin retail investor demand is at a 3-year low.”
With significant inflows back into exchanges, Bitcoin’s price might be difficult to keep up with an upswing.
However, an increase in accumulation buying as the price potentially decreases could save BTC from plunging further. If that happens, a possible swing toward $68.462 could be next for the coin.
Disclaimer
In line with the Trust Project guidelines, this price analysis article is for informational purposes only and should not be considered financial or investment advice. BeInCrypto is committed to accurate, unbiased reporting, but market conditions are subject to change without notice. Always conduct your own research and consult with a professional before making any financial decisions. Please note that our Terms and Conditions, Privacy Policy, and Disclaimers have been updated.


Be the first to comment