


History shows that Bitcoin (BTC) price correction is inevitable whether it is a bull market or not. However, this cycle has been different, especially as BTC reached a new all-time high before the halving in April.
Since the boom in the first quarter of 2024, the cryptocurrency’s price has been downhill. On-chain analysis dives into Bitcoin’s price prediction. Will respite appear, or are we in for another round of decline?
Bitcoin Slides Down Crucial Point
In Q1, the inflows into the approved Bitcoin ETFs drove the price to $73,750. Over the past few months, there has been a dearth of institutional capital. Thus, the ETFs no longer dictate the direction of the coin.
Instead, the activities of Short-Term Holders (STH) move BTC. STH refers to investors who purchased Bitcoin within the last 155 days. To assess Bitcoin’s potential in the short term, we will analyze the STH Realized Price.

The STH-Realized Price, also known as the on-chain cost basis, refers to the average price of the STH supply, valued at the period each coin last transacted on-chain.
As of this writing, BTC trades at $62,367. However, according to Glassnode, the STH-Realized Price is $64,410.
Read More: Who Owns the Most Bitcoin in 2024?
Historically, when the metric falls below the coin value, it supports the price. Hence, it leads to a higher value within a short period. On the other hand, a rise above Bitcoin’s price leads the cryptocurrency to a further decline.
BeInCrypto found evidence of this after examining the performance in 2018 and 2021. For instance, in December 2021, the STH Realized Price was $52,967. At that time, BTC changed hands at $50,492.
In less than two months, the price fell to $42,721. In January 2018, it was no different, with a Realized Price of $11,012 and BTC at $9,965. Before March, the price plunged to $7,852.
Whales, Retail Pass Vote of No-Confidence
Should Bitcoin fail to rise above the metric mentioned above, a further decline toward $60,000 could be next. While Bitcoin’s price has been falling for some time, whale accumulation has prevented it from another notable correction.
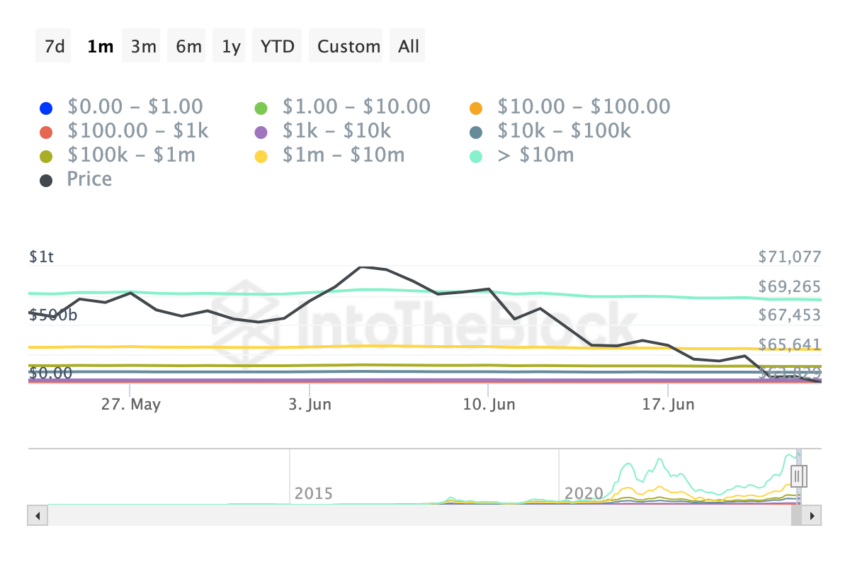
However, that position seemed to have changed based on the Balance By Holdings indicator. This on-chain metric tells if holders are adding to their balance and selling some coins. But this time, it’s not just whales letting go of some of their coins. The retail cohort is doing the same.
In the last 30 days, addresses holding BTC worth $100 to $10 million have been selling. Using the basic laws of demand and supply, these sell-offs put Bitcoin at risk of a major decline.
Meanwhile, Checkmatey, a pseudonymous analyst, posted on X that consolidation and correction are necessary before the price increases again.
“After 18 months of pure up-only price action, a period of several months of consolidating and correcting is not only expected but required.” He wrote.
BTC Price Prediction: No Support in Sight
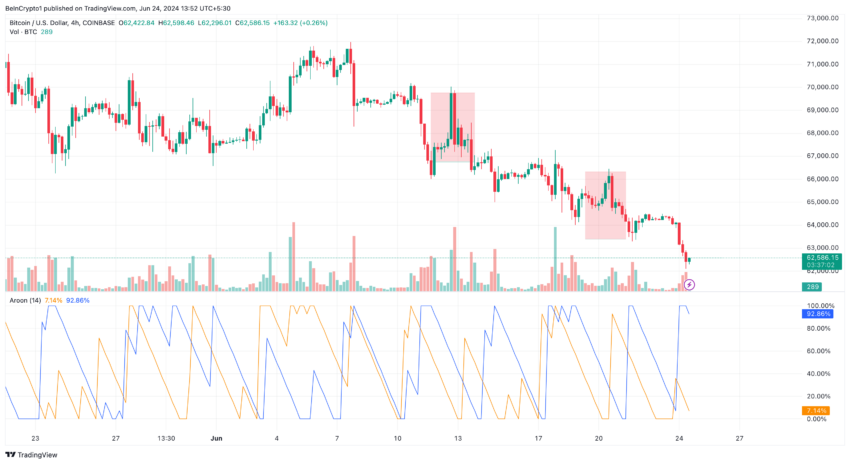
On the 4-hour timeframe, Bitcoin mirrors a pattern that led to a price decrease on June 12. Around that time, BTC fell from $69,747 to $66,633. On June 20, a similar thing occurred as the price dropped from $66,292 to $63,811.
Validation of the movement may send BTC to $61,560 for a start. If bulls fail to defend this, the coin’s price might slip below the $60,000 threshold.
Further, the Aroon indicator suggests a decline. The Aroon indicator allows traders to identify the direction in which a cryptocurrency trends. The indicator is divided into — Aroon Up (orange) and Aroon Down (blue).
When the Aroon Up is higher, it means the price will move upward. Conversely, the price will decrease if the Aroon Down outpaces its opposite number. At press time, the Aroon Down is much higher, indicating that Bitcoin will continue to fall.
Read More: What Is a Bitcoin ETF?
However, inflows in Bitcoin ETFs can invalidate this prediction. Last week, the financial products registered a net outflow, helping to put downward pressure on BTC’s price.
If capital flows into the products this week increase, Bitcoin will rebound. Another possible catalyst is retail participation and network growth. Compared to previous bull markets, the coin lacks these. The decreasing number of new unique addresses shows proof of this.
Should an influx of retail market participants start to buy BTC in large numbers, the price may not fall to $60,000. Instead, it may bounce to $66,000 or $67,000 in the short term.
Disclaimer
In line with the Trust Project guidelines, this price analysis article is for informational purposes only and should not be considered financial or investment advice. BeInCrypto is committed to accurate, unbiased reporting, but market conditions are subject to change without notice. Always conduct your own research and consult with a professional before making any financial decisions. Please note that our Terms and Conditions, Privacy Policy, and Disclaimers have been updated.

Be the first to comment