
 Price Jumps 7.5% in 24 Hours: Key Factors")

Bitcoin (BTC) has consistently performed well in the last few days, as the price has increased by 10.77% within the previous week. While this is good news for some traders, others risk losing money if the coin sustains the uptrend.
This analysis pinpoints the potential price levels BTC can reach and the trend’s impact on open positions in the derivatives market.
Bitcoin’s Recent Ride Threatens Shorts Expectations
In the last 24 hours, Bitcoin has fluctuated between $65,000 and a little above the $66,000 range—currently, the price trades at $65,302. But before that, BTC reached $66,250 and then fell again.
However, according to data from Coinglass, short positions risk liquidations worth up to $1.32 billion if BTC hits $68,066.
This is according to the liquidation heatmap. For those unfamiliar with the terminology, liquidation occurs when an exchange closes a trader’s position due to insufficient margin balance to keep the contract open.
While this is done to prevent further losses, the action could also be due to high volatility as the price moves in the opposite direction of the trader’s prediction.
Specifically, longs are those betting on a price increase, while shorts are traders aligned with a decrease.
Read More: 7 Best Crypto Exchanges in the USA for Bitcoin (BTC) Trading
Therefore, the image above shows how much shorts will lose once Bitcoin reaches the above price. Further, the heatmap identifies zones where large-scale liquidation might occur and zones where there is a high concentration of liquidity.
If liquidity is concentrated in a particular area, the crypto price will likely move toward that region. According to data obtained from Coinglass, Bitcoin’s price may approach $67,469 and then $68,000.
Should the coin clear these regions, the next area of interest will be $72,599, bringing it closer to its All-Time High (ATH).
Major Players Cease Bitcoin Sell-Off
Apart from the heatmap, the massive inflow into the Bitcoin ETFs this week is another piece of data supporting a price increase. The significant flow of capital into these products played a huge role in Bitcoin’s surge to its ATH in March.
The dearth of liquidity in this aspect was also vital to the downturn experienced in the second quarter (Q2). Therefore, BTC may see a sustained upswing if more money continues flowing into the ETFs.
Concerning this development, analyst Timothy Peterson opined that BTC could hit $71,000 soon.
“Cumulative Net ETF Flows reached a new ATH last week. This is the second metric I have that prices Bitcoin at $71k. This marks 6 consecutive days of positive inflows totaling $1+ billion. This does not include today’s presumably whopping inflows.” He stated on X.
From an on-chain perspective, the Accumulation Trend Score shows that Bitcoin has exited the distribution phase. The trend score ranges from 0 to 1, providing insights into the behavior of the market’s large entities.
If the Accumulation Trend Score rating is close to 0, it means that, on average, market participants are selling.
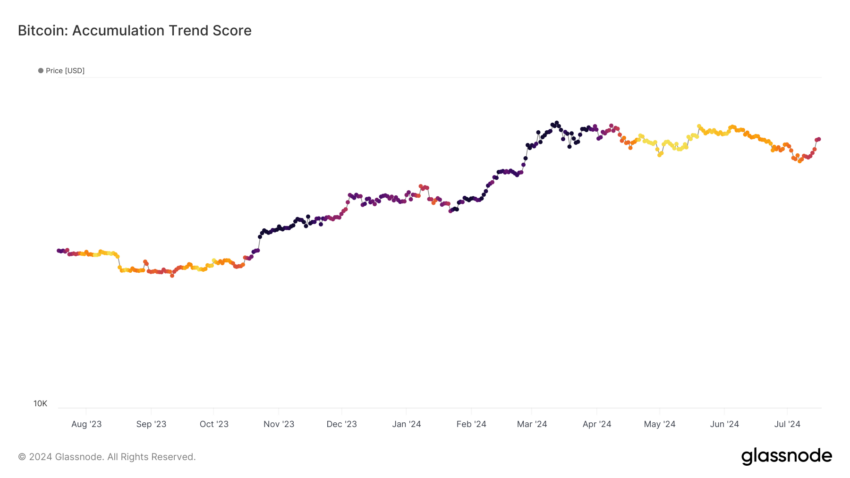
This is evident from the trend between April and June. However, at press time, the score is 0.55, indicating that the size of coins purchased on-chain is increasing.
BTC Price Prediction: Bullish Trend Confirmed
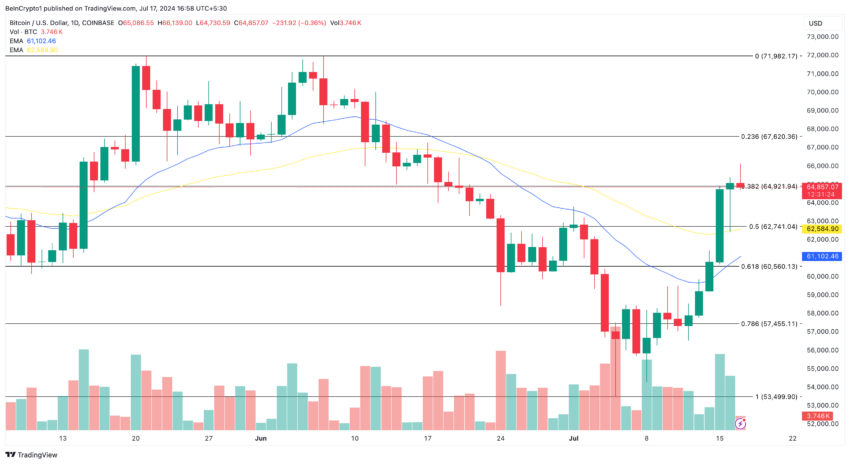
According to the daily chart, Bitcoin confirmed the bullish trend after the price rose above the 20 (blue) and 50 (yellow) EMAs.
EMA stands for Exponential Moving Average and shows trend direction over some time. If the EMA is above the price, the trend is bearish.
However, since it is the other way around, it is bullish for BTC, suggesting that the price can trade higher. If sustained, the next price Bitcoin will reach could be around $68,235, as shown below.
In addition, the spot Cumulative Volume Delta (CVD) is positive. The CVD displays the net difference between buying and selling volume. When it is negative, it means that the BTC sold is higher than the amount bought.
Hence, the positive value implies that market participants have been buying more Bitcoin volume since July 13. This is also reiterated by the Moving Average Convergence Divergence (MACD).
The MACD is a technical tool that shows the relationship between the 12 EMA (blue) and 26 EMA (orange) to measure trend momentum and price acceleration. If the reading is negative, the trend is bearish, and the price can decrease.
Read More: How To Buy Bitcoin (BTC) and Everything You Need To Know
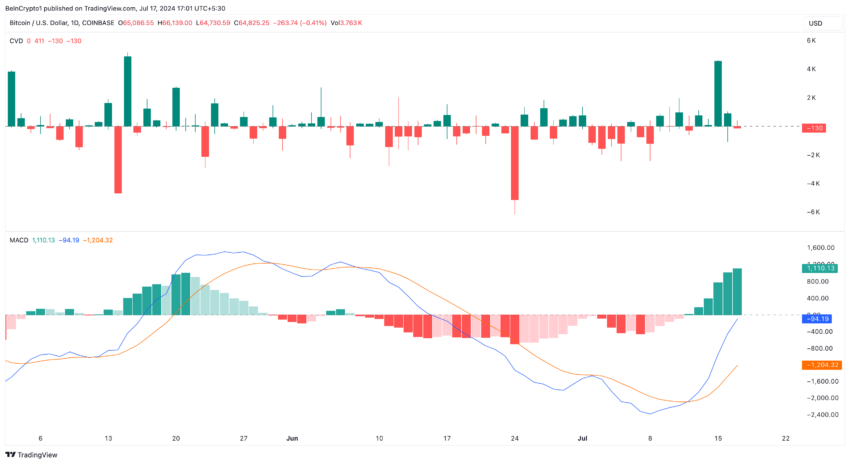
However, the MACD rating at press time is in the green zone, suggesting that Bitcoin’s price can continue its uptrend.
In conclusion, if large entities or whales begin to distribute the coin again, the potential price increase may be invalidated. If this is the situation, Bitcoin may drop to $60,899.
Disclaimer
In line with the Trust Project guidelines, this price analysis article is for informational purposes only and should not be considered financial or investment advice. BeInCrypto is committed to accurate, unbiased reporting, but market conditions are subject to change without notice. Always conduct your own research and consult with a professional before making any financial decisions. Please note that our Terms and Conditions, Privacy Policy, and Disclaimers have been updated.

Be the first to comment