
 Historical Data Signals October Bull Run Kickoff –")

Bitcoin finds itself at a critical juncture after weeks of intense volatility, marked by excitement and fear. Currently trading around $59,400, BTC is testing vital demand levels following a 10% dip from local highs of approximately $66,000.
This recent price action has sparked uncertainty among investors, some of whom remain hopeful for new all-time highs in this cycle. Many closely monitor Bitcoin’s next moves as the crypto market reacts to external factors.
A notable crypto analyst has shared a long-term chart highlighting an intriguing trend: historically, October has often signaled the beginning of bullish runs for BTC. This insight adds an element of optimism for those looking to capitalize on potential upward momentum.
As the market grapples with mixed sentiment, all eyes are on Bitcoin to see if it can reclaim lost ground and rally toward new highs.

The coming days will be pivotal as traders assess whether BTC can maintain its bullish trajectory or if further corrections lie ahead. Given the historical patterns and current market dynamics, investors are eagerly watching to see how this narrative unfolds.
Bitcoin Post-Halving Surge: Is It Near?
Bitcoin is currently navigating a highly volatile environment, leaving traders and investors uncertain. The price has shown no clear signs of direction or specific targets, causing concern among market participants.
Many analysts fear that the anticipated historical bull run following the recent halving may not materialize this time around, which could lead to missed opportunities for potential gains.
However, top crypto analyst Ali offers a glimmer of hope. He recently shared a compelling technical analysis on X, featuring a chart that underscores a significant trend: every major Bitcoin rally has historically initiated in October during halving years.
According to this analysis, Bitcoin has kicked off parabolic bull runs every October following halving events, and many believe this cycle should follow suit. This historical data has prompted numerous traders and investors to hold onto their coins, banking on the possibility of a resurgence.
This strategy could prove lucrative for some, potentially leading to substantial profits. Conversely, it could also spell trouble for overly optimistic people, especially if BTC fails to deliver on these expectations.
As October unfolds, the market remains in a state of suspense. Traders know that the coming weeks will be pivotal in determining Bitcoin’s trajectory.
While the potential for a bull run looms, the risks of further volatility and corrections linger, making it a crucial time for those invested in this dynamic asset. The interplay between historical patterns and current market dynamics will shortly shape BTC’s fate.
BTC Testing Crucial Demand
Bitcoin trades at $61,350 after facing resistance at the 4-hour 200 exponential moving average (EMA) at $61,645. The price remains above the 4-hour 200 moving average (MA) at $60,363, a crucial support level for bulls aiming to regain strength.
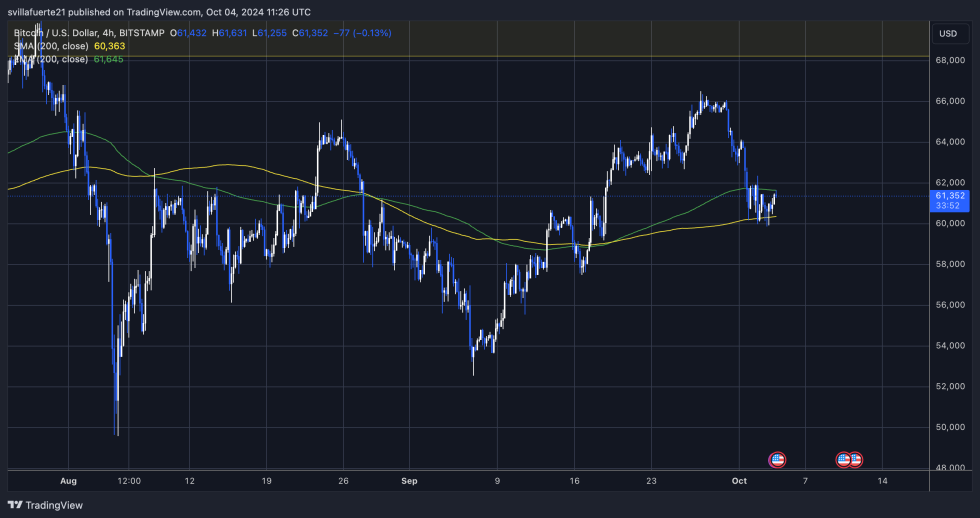
BTC must break above the EMA and test higher supply levels, particularly around $66,000, to continue the uptrend. If successful, this could signal a strong bullish momentum heading into the coming weeks.
However, failure to maintain above the 4-hour 200 MA could lead to a deeper correction, with potential targets around $57,500 or even lower. Traders closely monitor these key indicators, as the current price action reflects a critical juncture for Bitcoin.
The next few sessions will likely determine whether bulls can reclaim control or if a bearish trend will take hold. Investors should stay vigilant, as volatility may increase, influencing market sentiment and price direction. The interplay between these technical levels will be essential for traders navigating the crypto market’s uncertainty.
Featured image from Dall-E, chart from TradingView

Be the first to comment