


Ripple’s rally lags behind other cryptocurrencies’ rallies for 2023
A bullish flag pattern suggests more upside
Once the bullish flag is confirmed, a double bottom pattern projects the price even higher
Ripple rallied against the US dollar in 2023 as the entire cryptocurrency market bounced. However, unlike Bitcoin, Ripple rallied less.
One explanation may come from the current consolidation. The chart below shows the daily timeframe, and the recent price action reveals a tight range lasting several weeks.
So what does the technical picture says about XRP/USD?

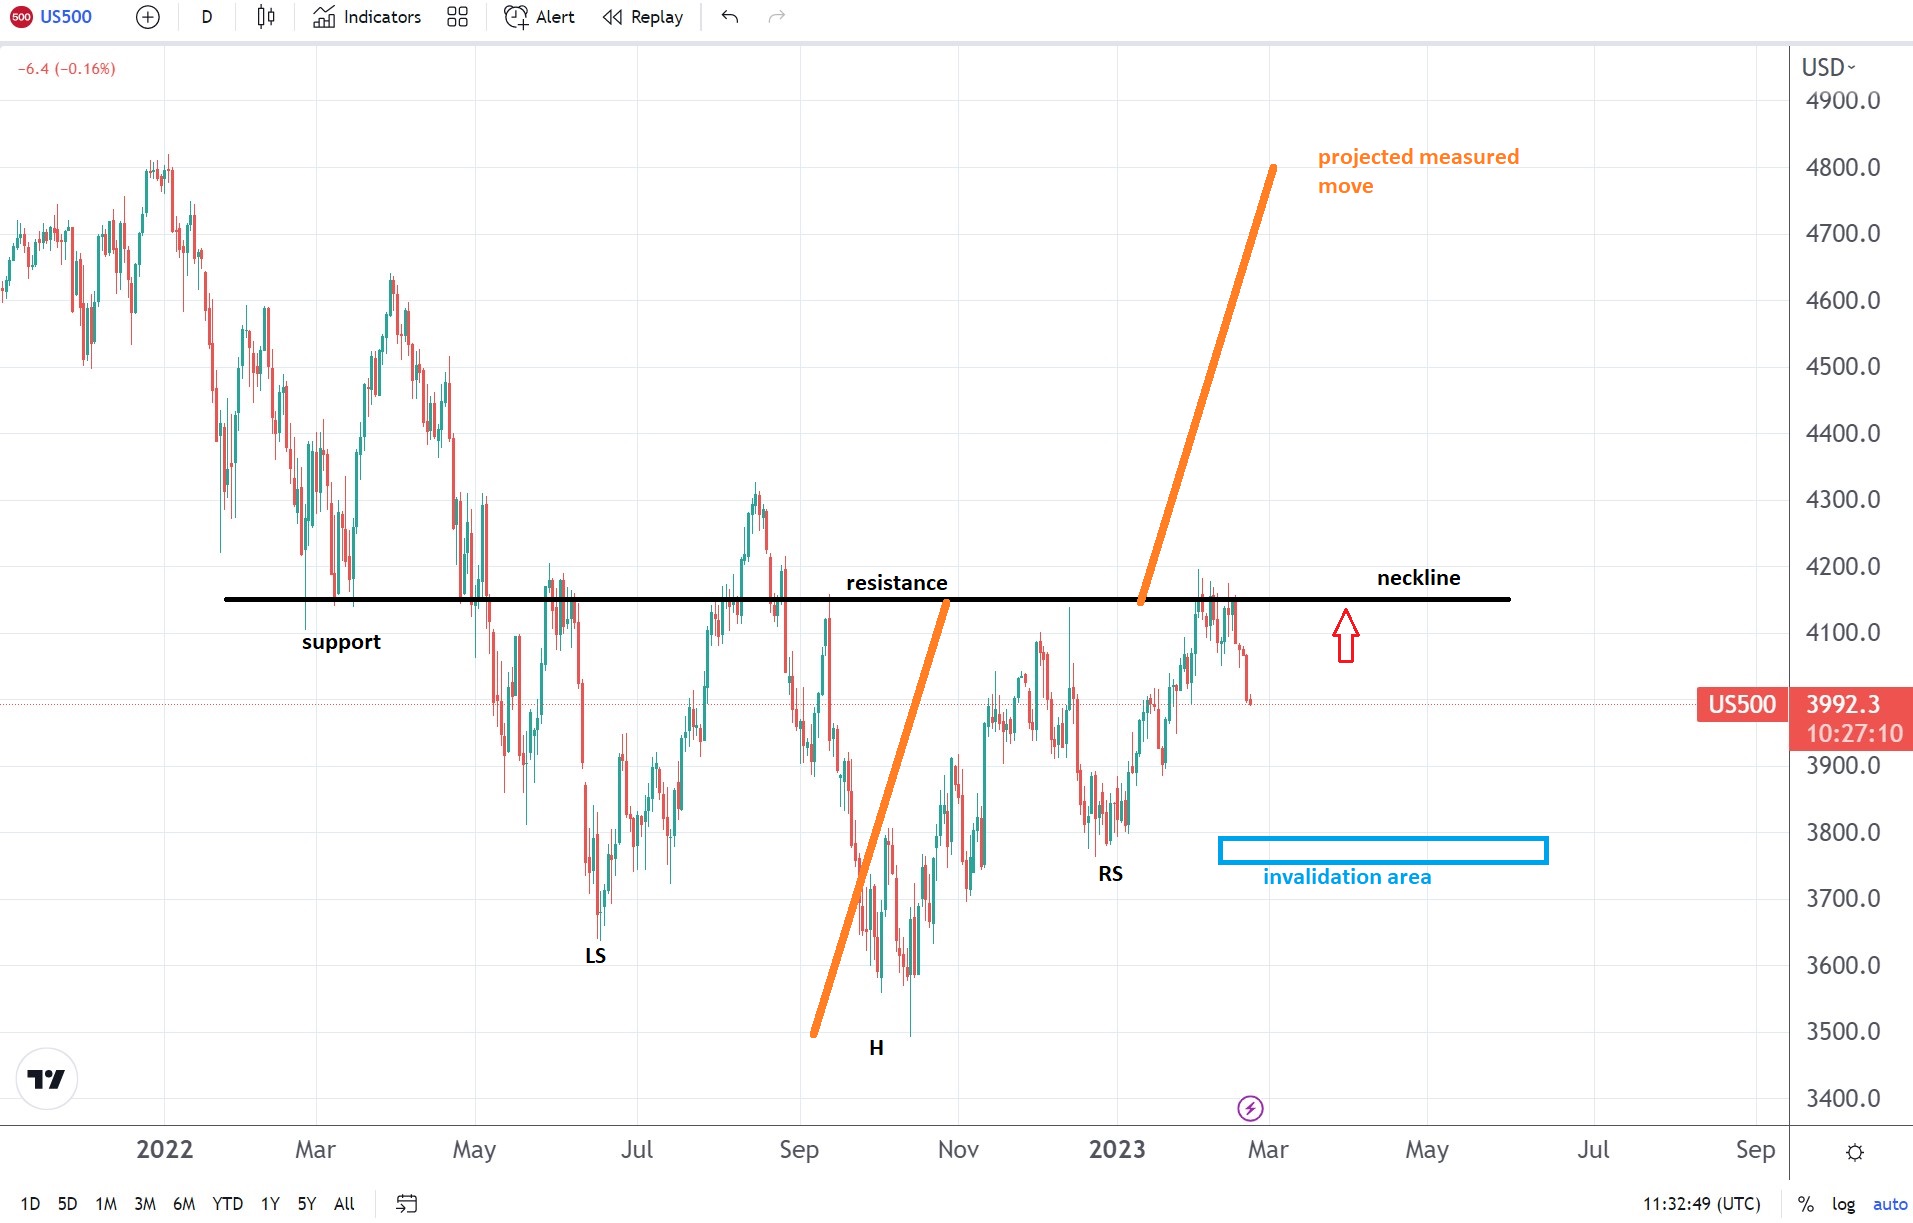
XRPUSD chart by TradingView
Bullish technical setup for XRP/USD, providing the 2023 lows hold
A double top pattern may be spotted on the left side of the chart. Ripple failed twice at $0.9 before reversing sharply.
It declined in line with the overall cryptocurrency market as investors fled, scared of scams and after losing faith in various crypto projects.
A double top is a reversal pattern. The key to trading the pattern is waiting for the price to move below the neckline.
Then, projecting the measured move, one can determine the minimum distance the market should move to confirm the reversal.
After the reversal pattern was confirmed by the price action reaching the measured move, Ripple entered a long period of consolidation. Ripple trades in a tight range against the dollar for almost eight months now. That is, a tight range considering the cryptocurrency market standards.
Currently, one can spot two bullish factors for Ripple. First, a double bottom pattern might be in the makings. Still incomplete, it points to $0.7 should the price move above the neckline.
Second, the most recent price action looks like the flag of a bullish flag pattern. If it is confirmed by future price action, then the measured move points to a break above the double bottom’s neckline.
To sum up, the bullish flag’s measured move exceeds the double bottom’s neckline. Hence, bulls may want to buy on a daily close above $0.45 and place a take-profit at $0.7.
The invalidation point of this bullish setup is a move below $0.3.

Be the first to comment