With another month of Bitcoin (BTC), Ether (ETH), and most altcoins in red or in a rangebound trajectory all eyes are hoping for greener price charts for top cryptos in the last quarter.
“Wake me up when September ends,” was the predominant sentiment for a majority of cryptocurrency HODLers over the last month. As macro conditions continued to dictate the short-term path for cryptocurrencies, bearish sentiment took over the larger market.
Throughout September, bearish opinions gained much more heat as seen in the red bars below representing how many mentions there are of sell, selling, sold, or bearish.
Decreased demand
The total fees spent to use a blockchain presents the willingness to spend and demand to use it. Over the last quarter, Bitcoin fees generated just under $30 million from the network, declining from $42.9 million in Q2 2022.
On the other hand, Ethereum fees dropped even further, from $1.29 billion in Q2 to $264 million in Q3 charting a 79% fall quarter over quarter (q-o-q).
While there was a decrease in blockchain demand, prices held relatively well with Bitcoin in consolidation and Ether appreciating by 30% q-o-q.
Additionally, net flows indicated that while BTC saw a neutral sentiment, ETH saw a more bullish stance as compared to BTC. Bitcoin recorded modest inflows into centralized exchanges of under $50 million, higher than the $192 million net outflows from Q2.
For Ether, over $1 billion ETH left exchanges for the fourth straight quarter, while outflows in Q3 were $57 million lower than those from Q2.
3 things to remember in October
Bitcoin’s price has struggled to keep up with the psychological support barrier of $20,000 throughout September. Without a good pump from whales and retailers, a significant uptick in price seems like a distant dream.
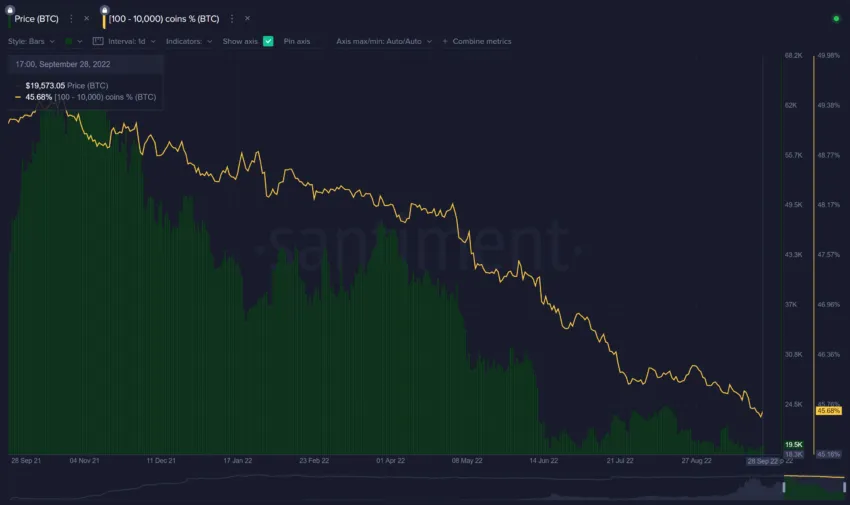
Whale metrics from Santiment presented that there is neither whale accumulation nor major utility in BTC to be excited about at press time.

The key-tier BTC whales who hold between 100 and 10,000 BTC are continuing to dump. Over the past year, these key addresses have dropped 3.5% of the supply to addresses that have much less impact on future price movement. In September alone, another 0.4% of BTC’s supply was dumped. In October a key trend to watch out for is would-be whale accumulation.
The amount of unique BTC moving from address to address remains scarce, which has led the NVT signal to present a bearish signal for a second straight month. An uptick in the same could prove to be a bullish indicator.

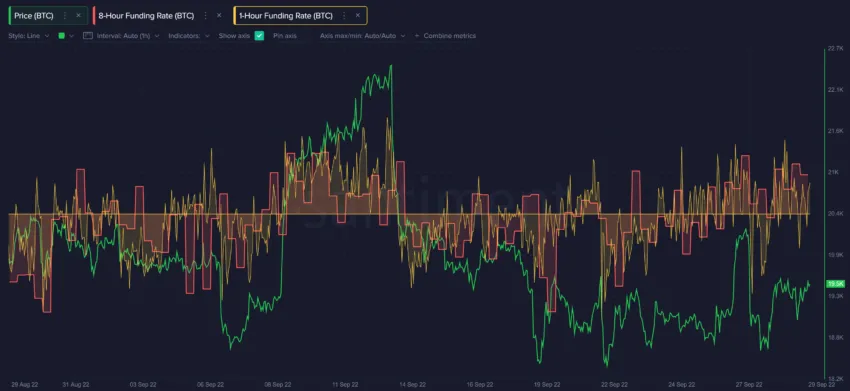
A look at BTC funding rates presented another worrying trend where traders are longing gradually more and more when the price doesn’t dump. After the longs get high enough, another dump takes place, traders attempt to short temporarily, and they then give up and begin to long again.

Thus, going forward watching the aforementioned key indicators could be crucial. A reversal in these on-chain metrics could present a bullish turn for BTC, ETH, and the larger market.
For Be[In]Crypto’s latest Bitcoin (BTC) analysis, click here
Disclaimer
All the information contained on our website is published in good faith and for general information purposes only. Any action the reader takes upon the information found on our website is strictly at their own risk.


Wow, amazing weblog layout! How long have you ever been blogging for?
you made blogging glance easy. The entire glance of your website is great, let alone the content material!
You can see similar here sklep online